MAKE A GIFT
Every day, the experts at Giffords Law Center work tirelessly to craft, enact, and defend the gun safety policies and programs that save lives. A safer America is within reach, but we need your courage and commitment to get there.


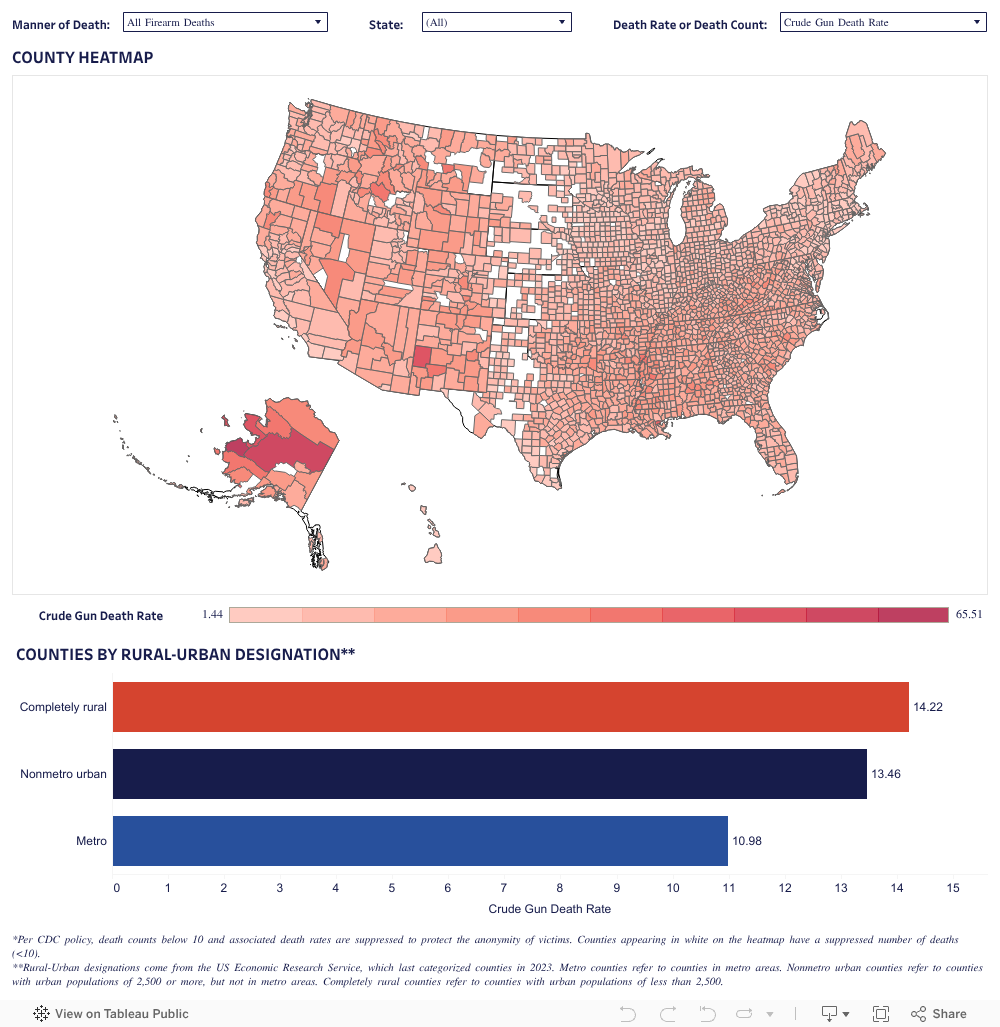
Every year, the data is clear: States with strong gun laws have less gun violence. See how your state compares in our annual ranking.
Read More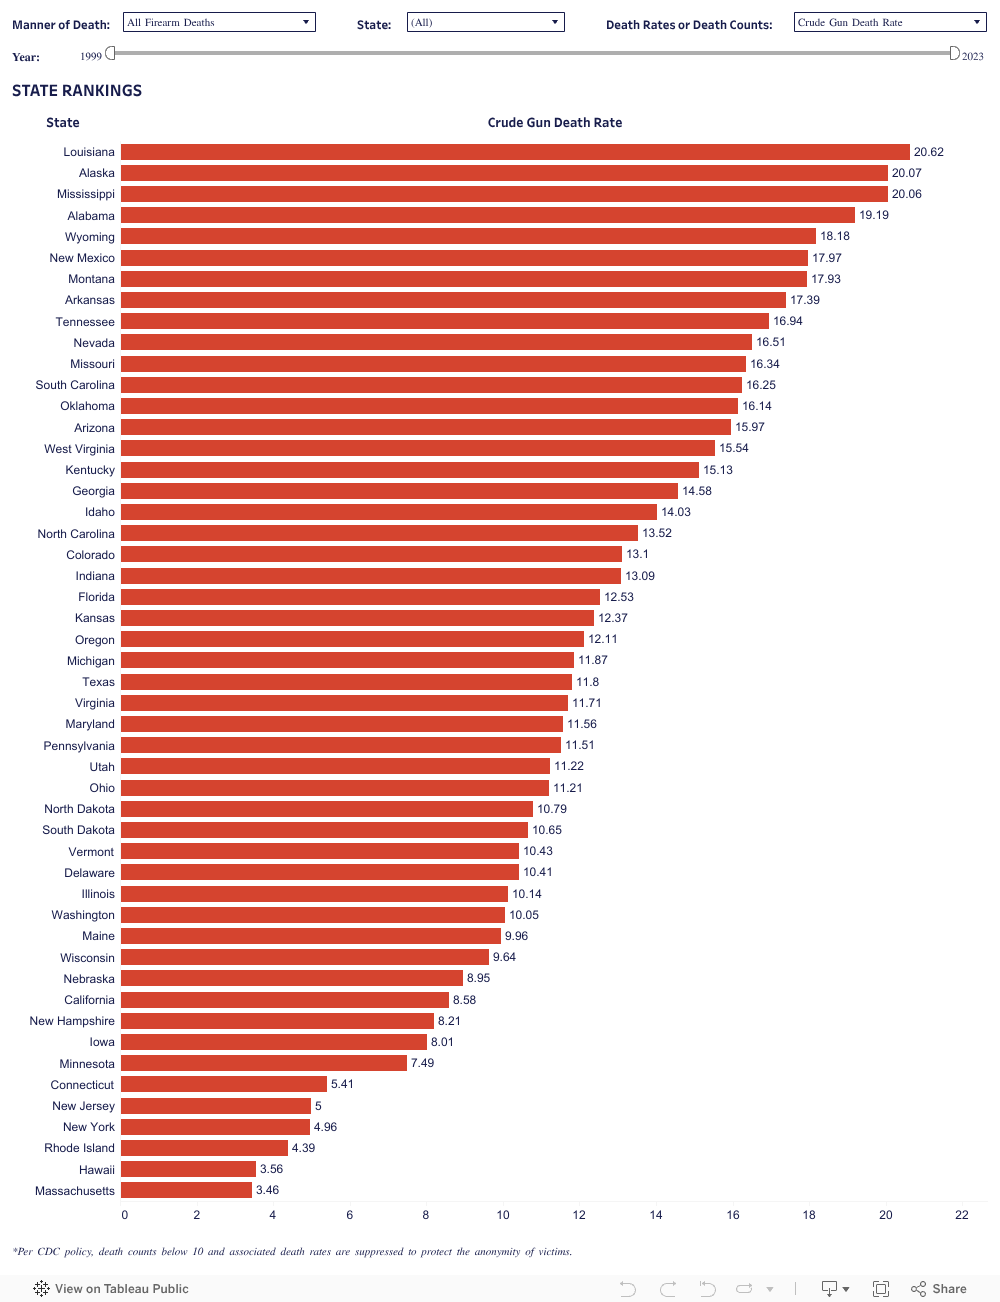
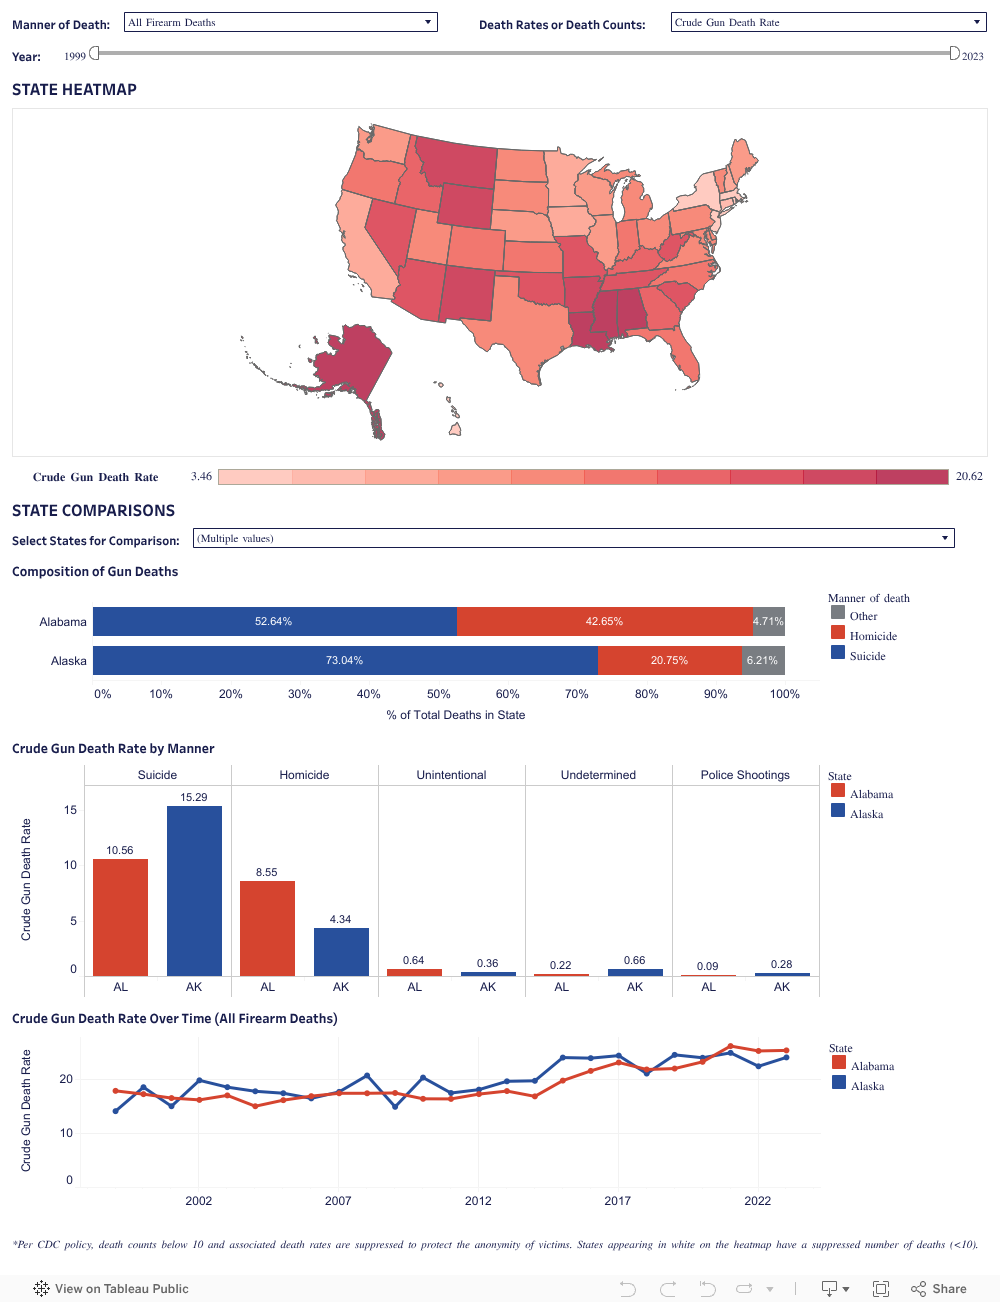
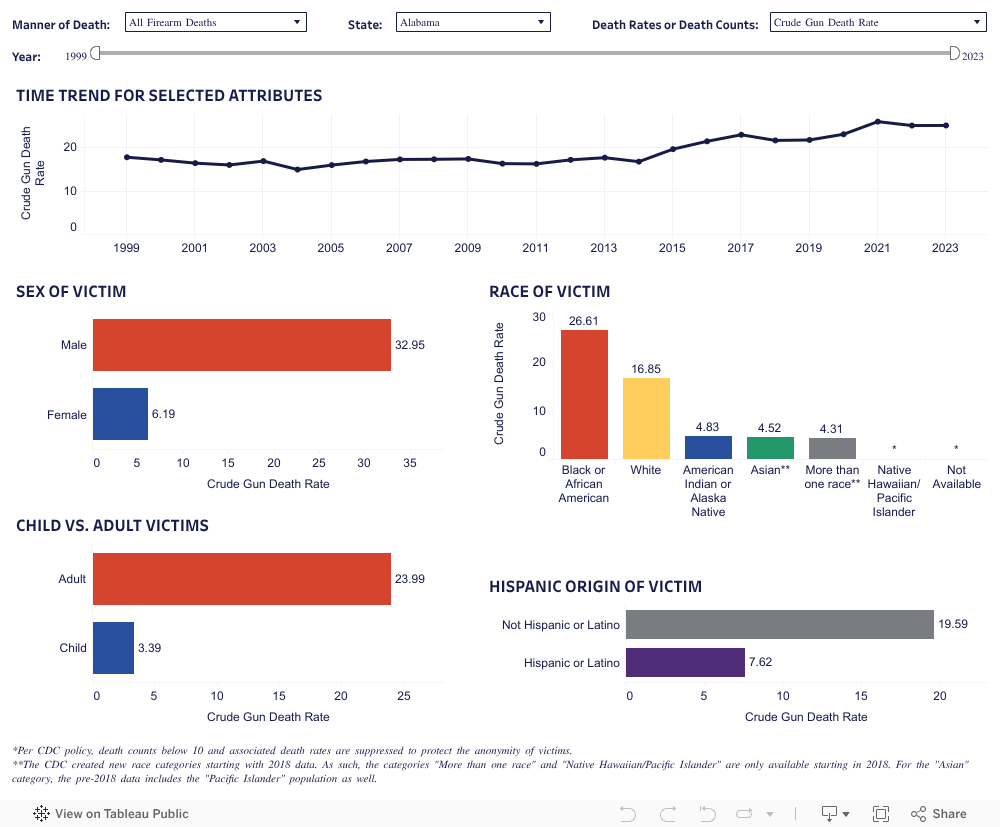

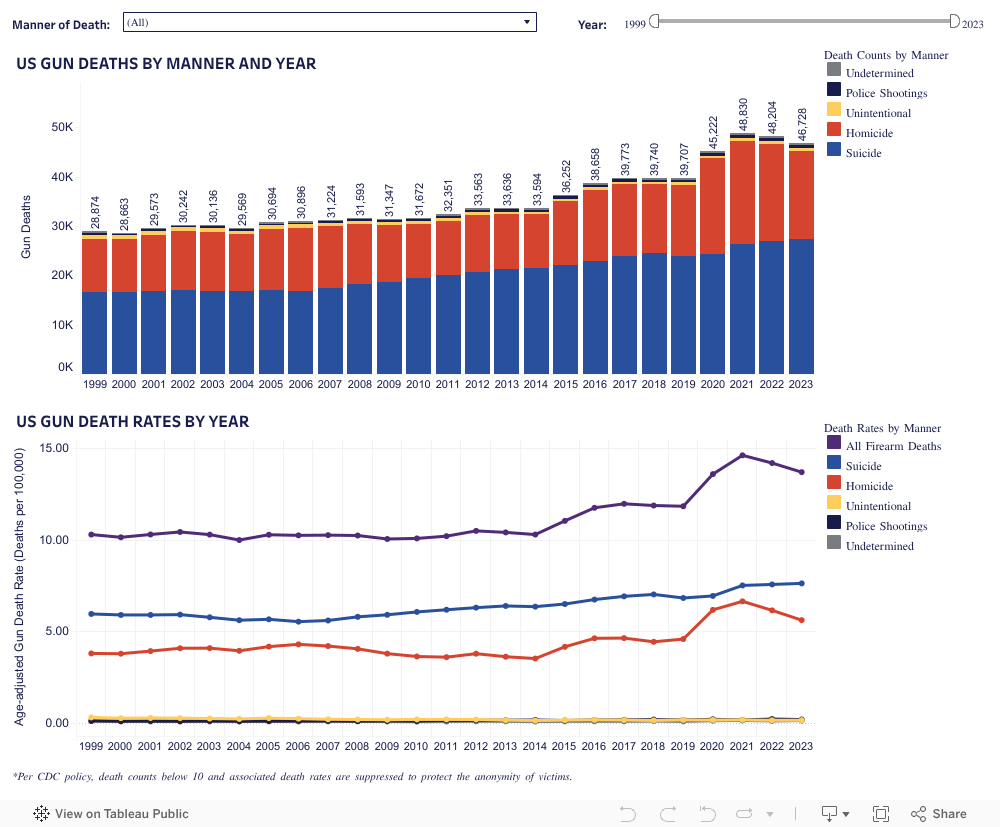
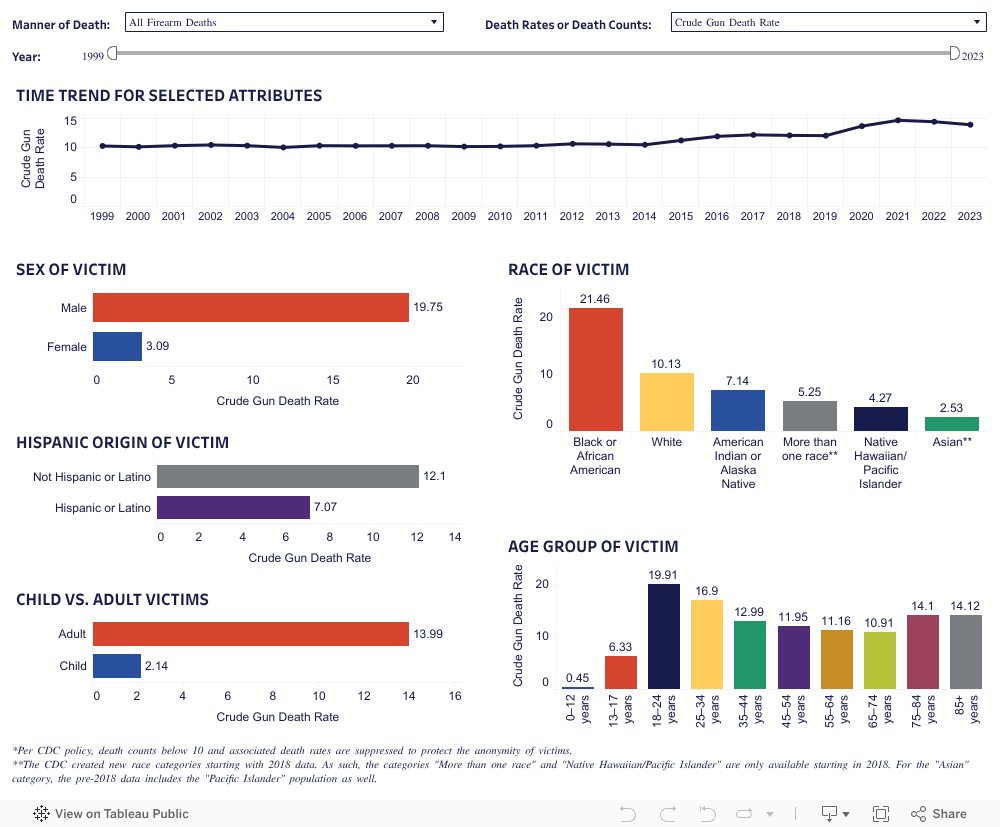
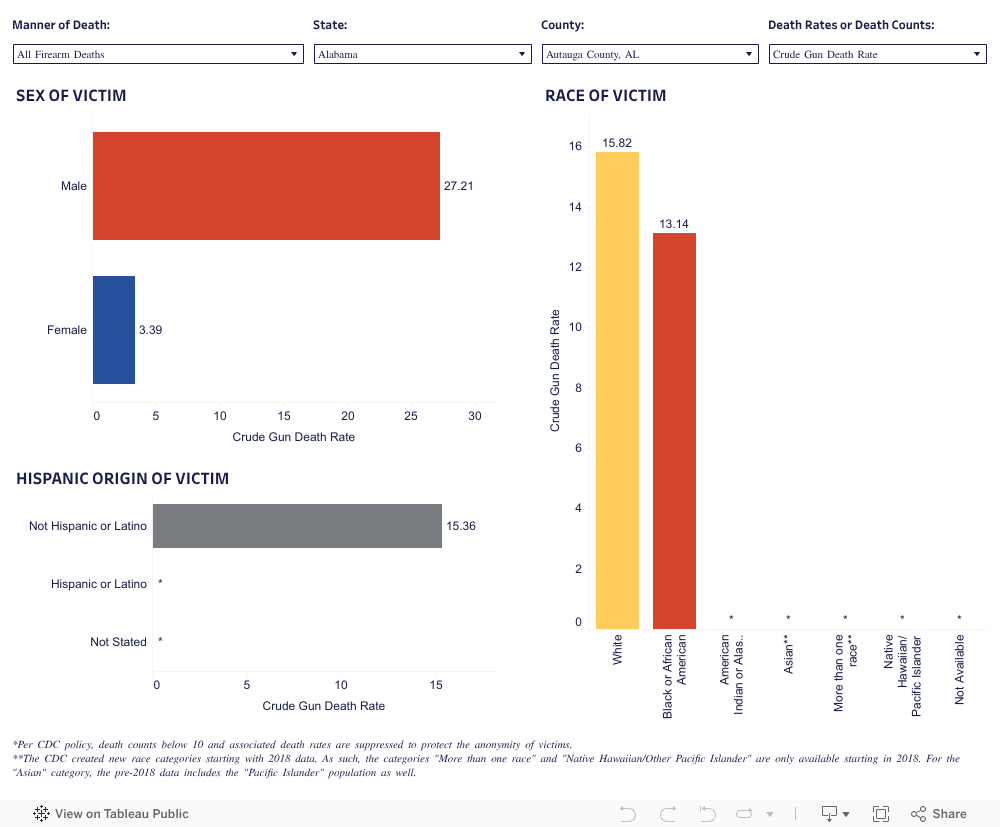
Explore facts, figures, and original analysis compiled by our experts. To end our gun violence crisis, we need to better understand where, how, and why violence occurs.
Learn More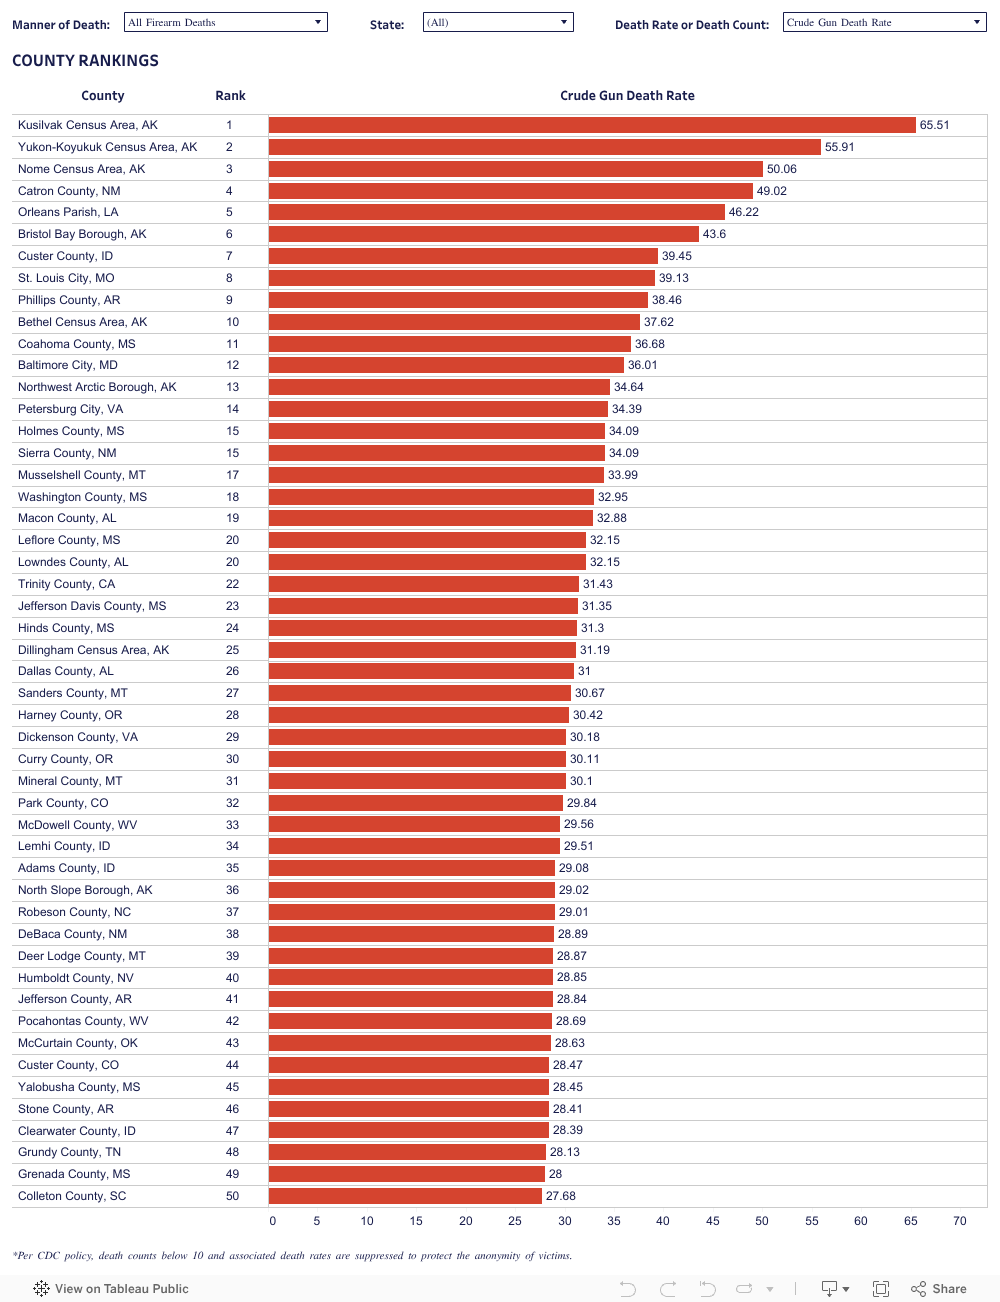


Every day, the experts at Giffords Law Center work tirelessly to craft, enact, and defend the gun safety policies and programs that save lives. A safer America is within reach, but we need your courage and commitment to get there.