
Gun Violence in Hispanic & Latino Communities
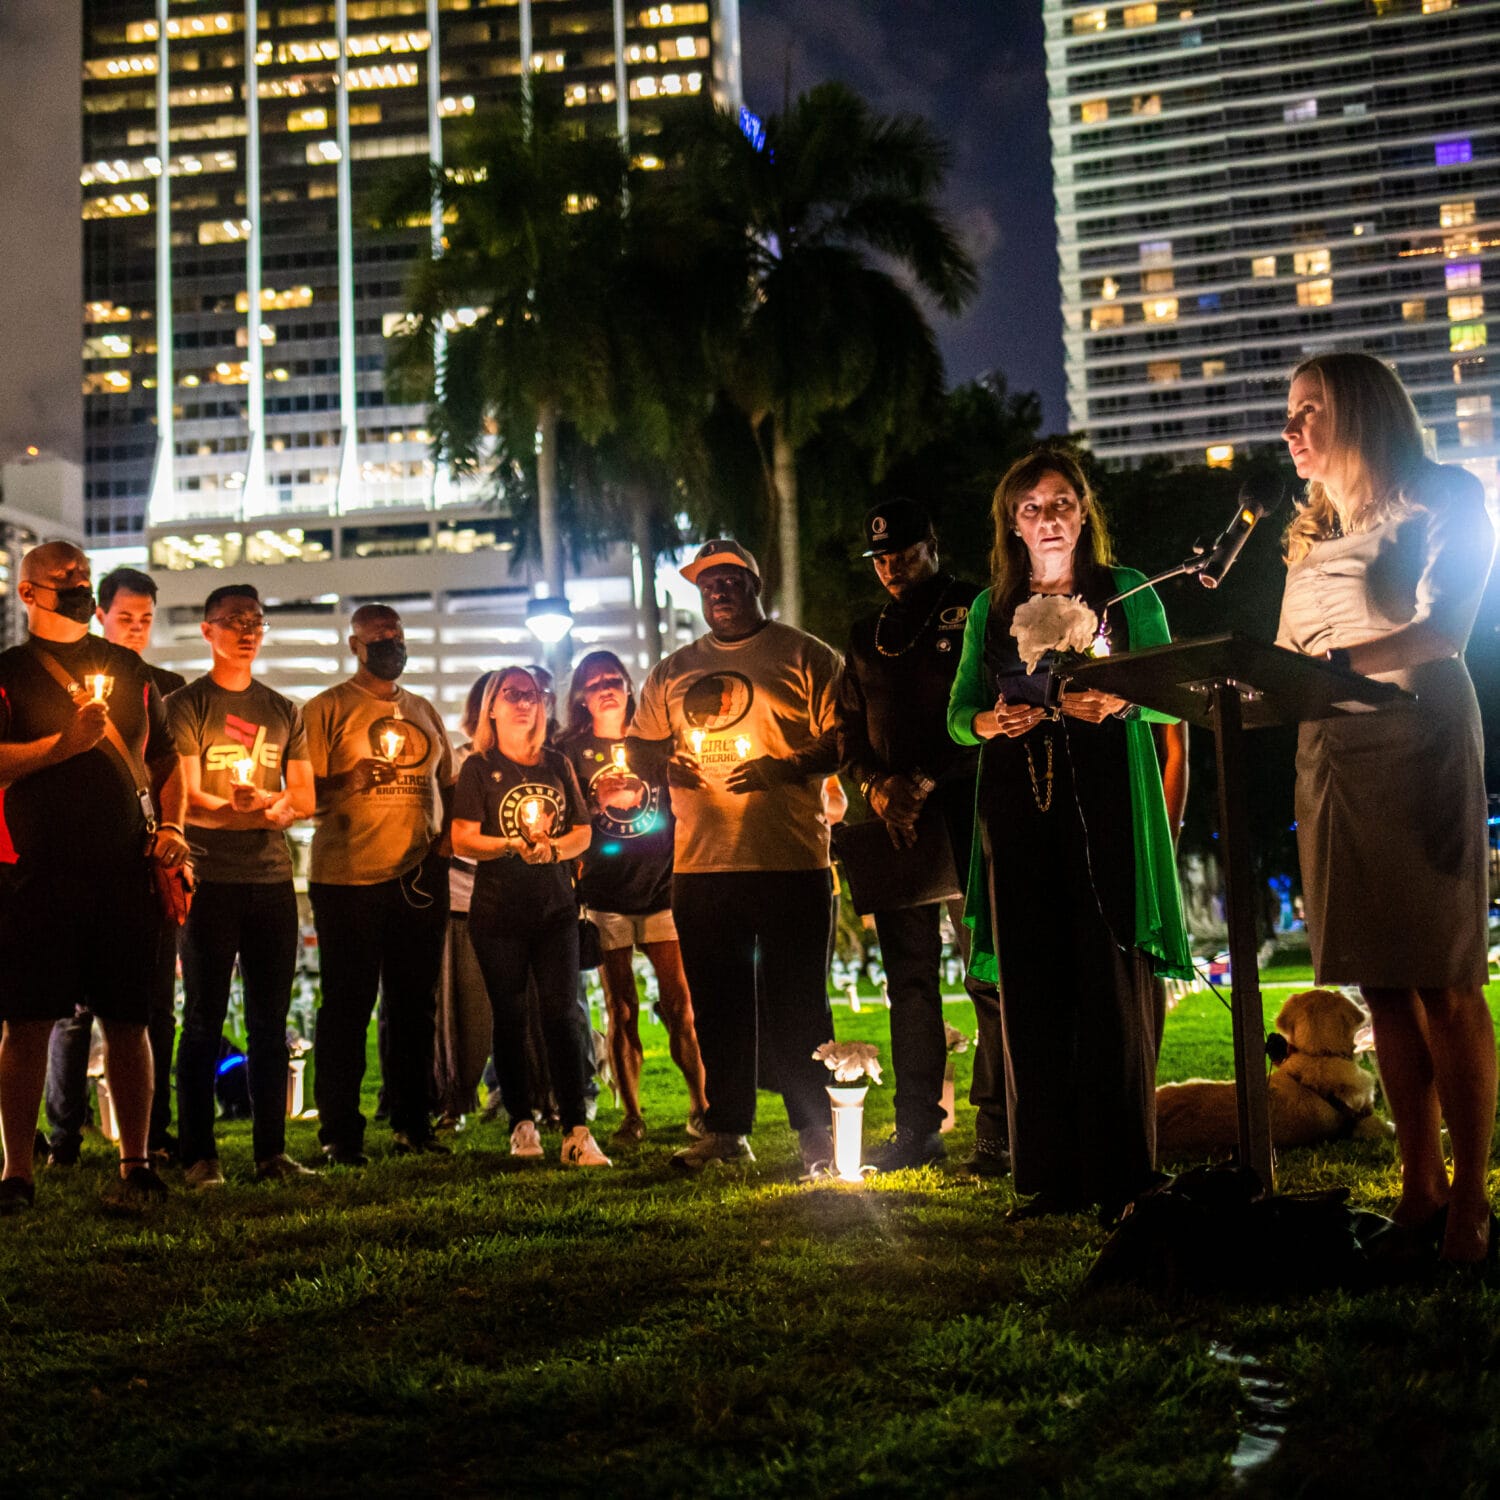
Over the past few years, there have been a number of tragic, high-profile incidents of gun violence in the Hispanic and Latino community.
Violencia con armas de fuego en comunidades hispanas y latinas
—Apr 02, 2026
These atrocities made headlines across the nation and shocked our collective consciousness, but much less discussed is the regular, unrelenting toll that gun violence takes on Hispanic and Latino communities. On average, more than 15 Latinos die from gun violence every day.5 Almost half of all Latino youth in major US cities live less than a mile away from a gun homicide that occurred in the past year.6 And gun violence in the Latino community has risen nearly three times faster than the national average over the last decade: Latino gun deaths have risen 61% from 2015 to 2024 compared to only a 23% rise seen nationally.7
Understanding the scope of this alarmingly growing problem is critical to illustrate the devastating extent of gun violence in the Hispanic and Latino community. This community bears a disproportionate toll of this epidemic compared to other demographic groups in this country, and understanding this burden is essential to creating and implementing responsive solutions.
Nearly one in every five people living in the US are Hispanic or Latino, making this community the second largest racial/ethnic group in the country.8 Hispanic and Latino communities include people from various countries of origins and ethnic backgrounds including two dozen countries from Central and South America.9
This memo relies on mortality data from the Centers for Disease Control and Prevention (CDC), which categorizes race and ethnicity separately. The CDC data is the more complete source of information on firearm mortality and utilizes the label “Hispanic or Latino” as an ethnicity category in their dataset. The terms “Hispanic” and “Latino” are often used interchangeably to describe this group, though these terms technically have different meanings. Latino refers to people of Latin American origin, while Hispanic refers to people of Spanish-speaking countries.10 This report uses “Latino” referring to the CDC data or to Hispanic and Latino communities more broadly.
While the CDC’s data classifications are in line with other federal data collection protocols, including that of the US Census, the broad categorization of Hispanic and Latino may mask important differences among subgroups of this population. For example, this data does not provide breakdowns by specific Hispanic and Latino ethnic groups who may face different risks for gun violence.11
Gun violence kills nearly 5,500 Latinos in the US every year.12 The Latino community, particularly Latino youth, has been disproportionately impacted by gun violence. Gun deaths among Hispanic people have increased at nearly three times the rate of gun deaths nationally. From 2015 to 2024, the number of Latino gun deaths rose 61%; comparatively, national gun deaths rose 22%.13
Firearm homicides account for almost 60% of all Latino gun deaths.14 Firearm homicide deaths take a disproportionate toll on Latino Americans compared to many other racial and ethnic groups. In fact, the Latino firearm homicide rate is more than double the non-Hispanic white firearm homicide rate.15
Furthermore, nearly three-quarters of Hispanics and Latinos live in only nine states, leading to a disparate geographic concentration of Hispanic gun deaths.16 For example, in New Mexico, 65% of gun homicide victims are Hispanic, despite this group comprising just half of the state’s population.17 Comparatively, non-Hispanic white residents of New Mexico make up only 36% of the population and only 18% of gun homicides.3 Similarly in California, half of all gun homicide victims are Latino, despite this group only accounting for 40% of the state’s population.3 Contrastingly, non-Hispanic white residents make up a similar percentage of the population (35%) but a smaller proportion of gun homicide victims (13%).3
Young Latino men experience some of the highest rates of gun violence. Gun violence is the leading cause of death for Hispanic male youth ages 15 to 19 and the third leading cause of death for Hispanic male adults ages 20 to 44.18 Unfortunately, the Latino and Hispanic communities have disproportionately borne the impact of our country’s gun violence epidemic for decades. In fact, gun homicides have been the second leading cause of death for Hispanic males ages 15 to 34 for over 20 years.19
Currently, the firearm homicide rate for Latino male youth ages 15 to 19 is nearly five times higher than the non-Hispanic white youth of the same age.20 Exposure to high rates of gun violence is associated with a host of negative mental health outcomes, including psychological distress, depression, and suicidal ideation in Black and Latino youth.21
More than 2,000 Latinos die by gun suicide each year.22 While the Latino gun suicide rate is lower than the national gun suicide rate, gun suicide rates in the Latino community are growing faster than national averages. From 2020 to 2024, gun suicide rates rose nearly 18% in the Latino community compared to a 9% increase nationwide.23
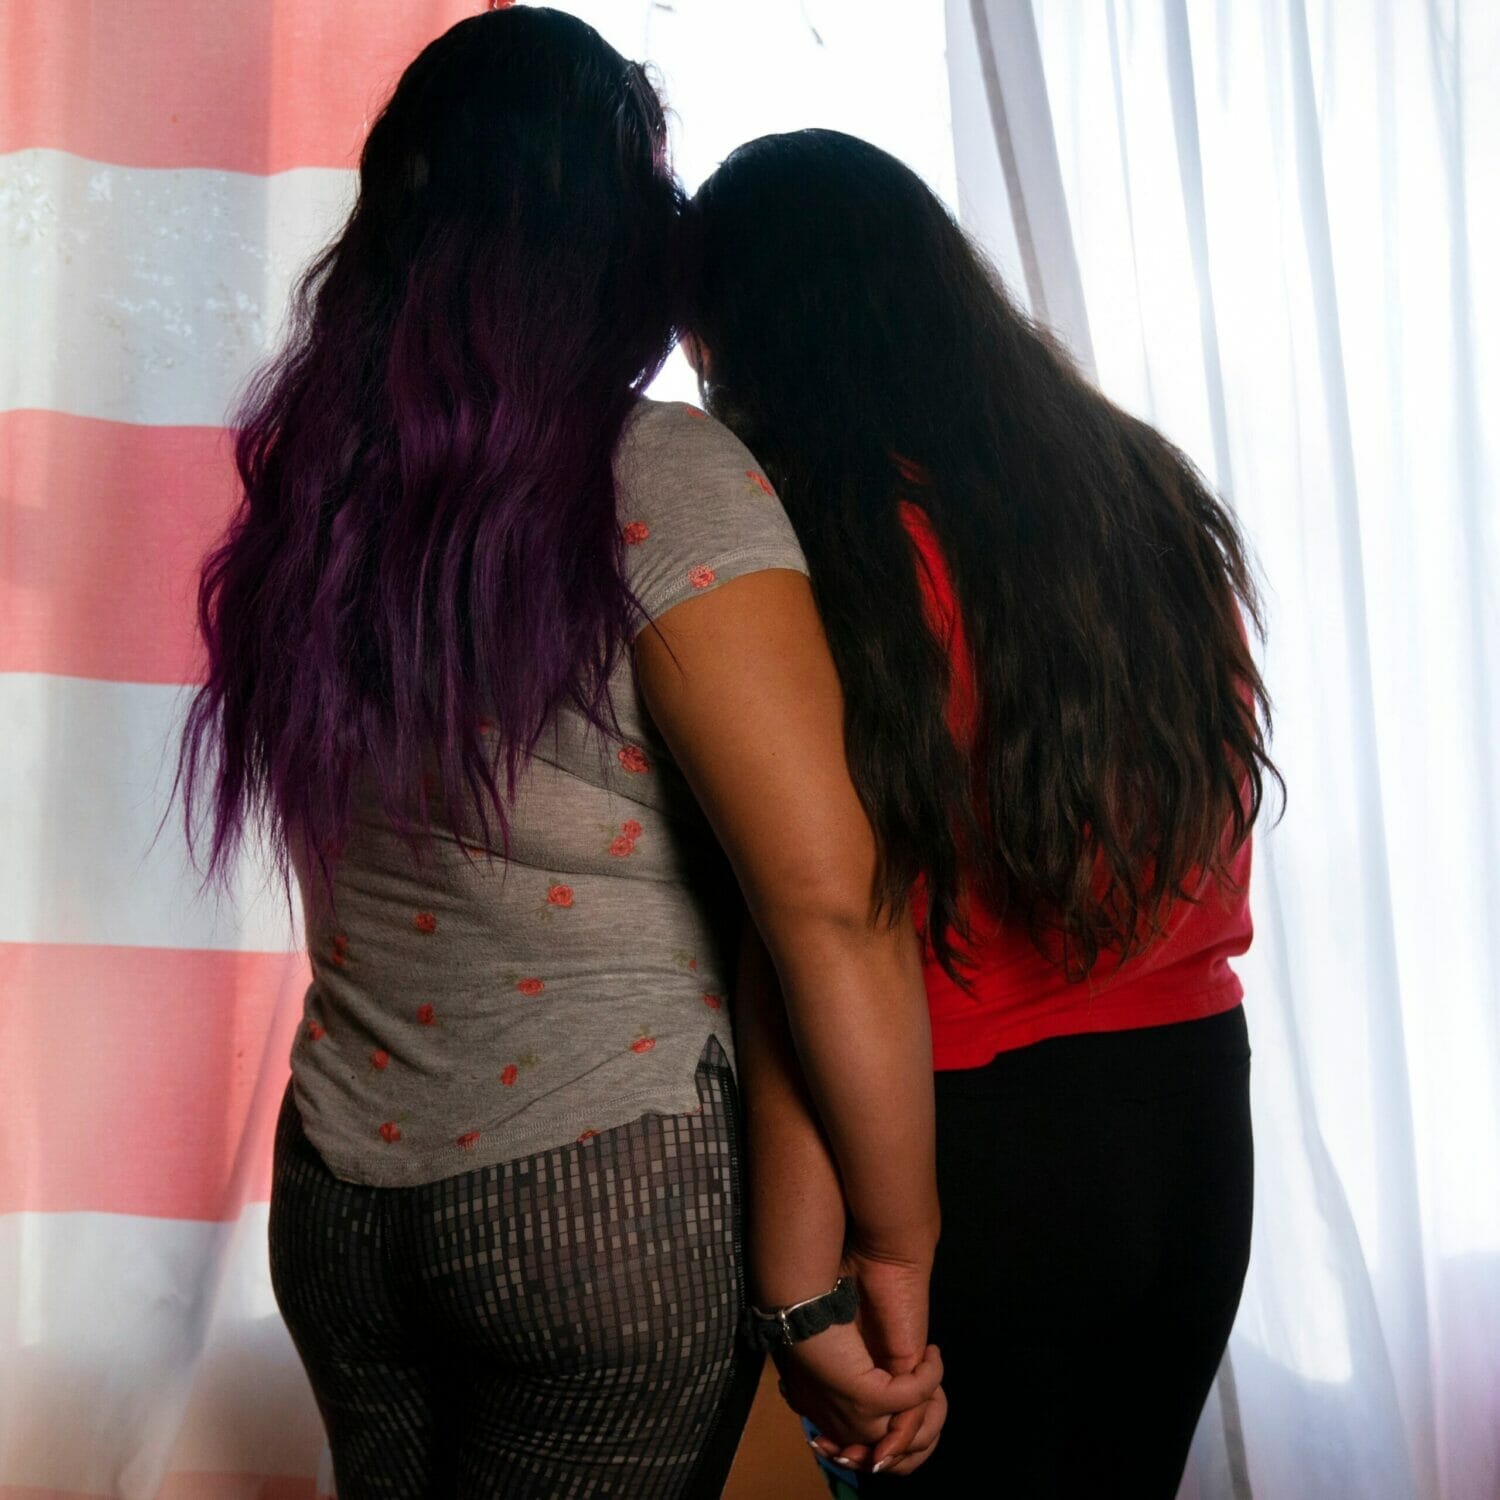
In recent years, there has a troubling increase in suicide among Latina women. From 2020 to 2024, the Latina gun suicide rate rose 27%.24 These increases have disproportionately impacted younger Latinas. Between 2020 and 2024, the Latina firearm suicide rate for those between the ages of 15 and 24 rose nearly 31% while the firearm suicide rate for Latino men of the same ages remained essentially unchanged.25 The overall national female gun suicide rate for those 15 to 24 years old rose only 7% during the same period.26
The Latino community also experiences disproportionately high rates of fatal police shootings.27 On average, law enforcement shoots and kills more than 200 Latinos each year.28 Just as with firearm homicides, Hispanic people die from fatal police shootings at rates 1.3 times more than non-Hispanic whites.29 In fact, in New Mexico, where about half of all residents are Latino, police shoot and kill Latinos at a rate nearly double that of their non-Hispanic white counterparts.30 Similarly, in California, which also has a high Latino population, Latinos die from fatal police shootings at 1.65 times the rate of non-Hispanic whites in the state.31 Tragically, police violence within the Hispanic and Latino community has been rising—from 2011 to 2020, fatal encounters with law enforcement grew 44%.32
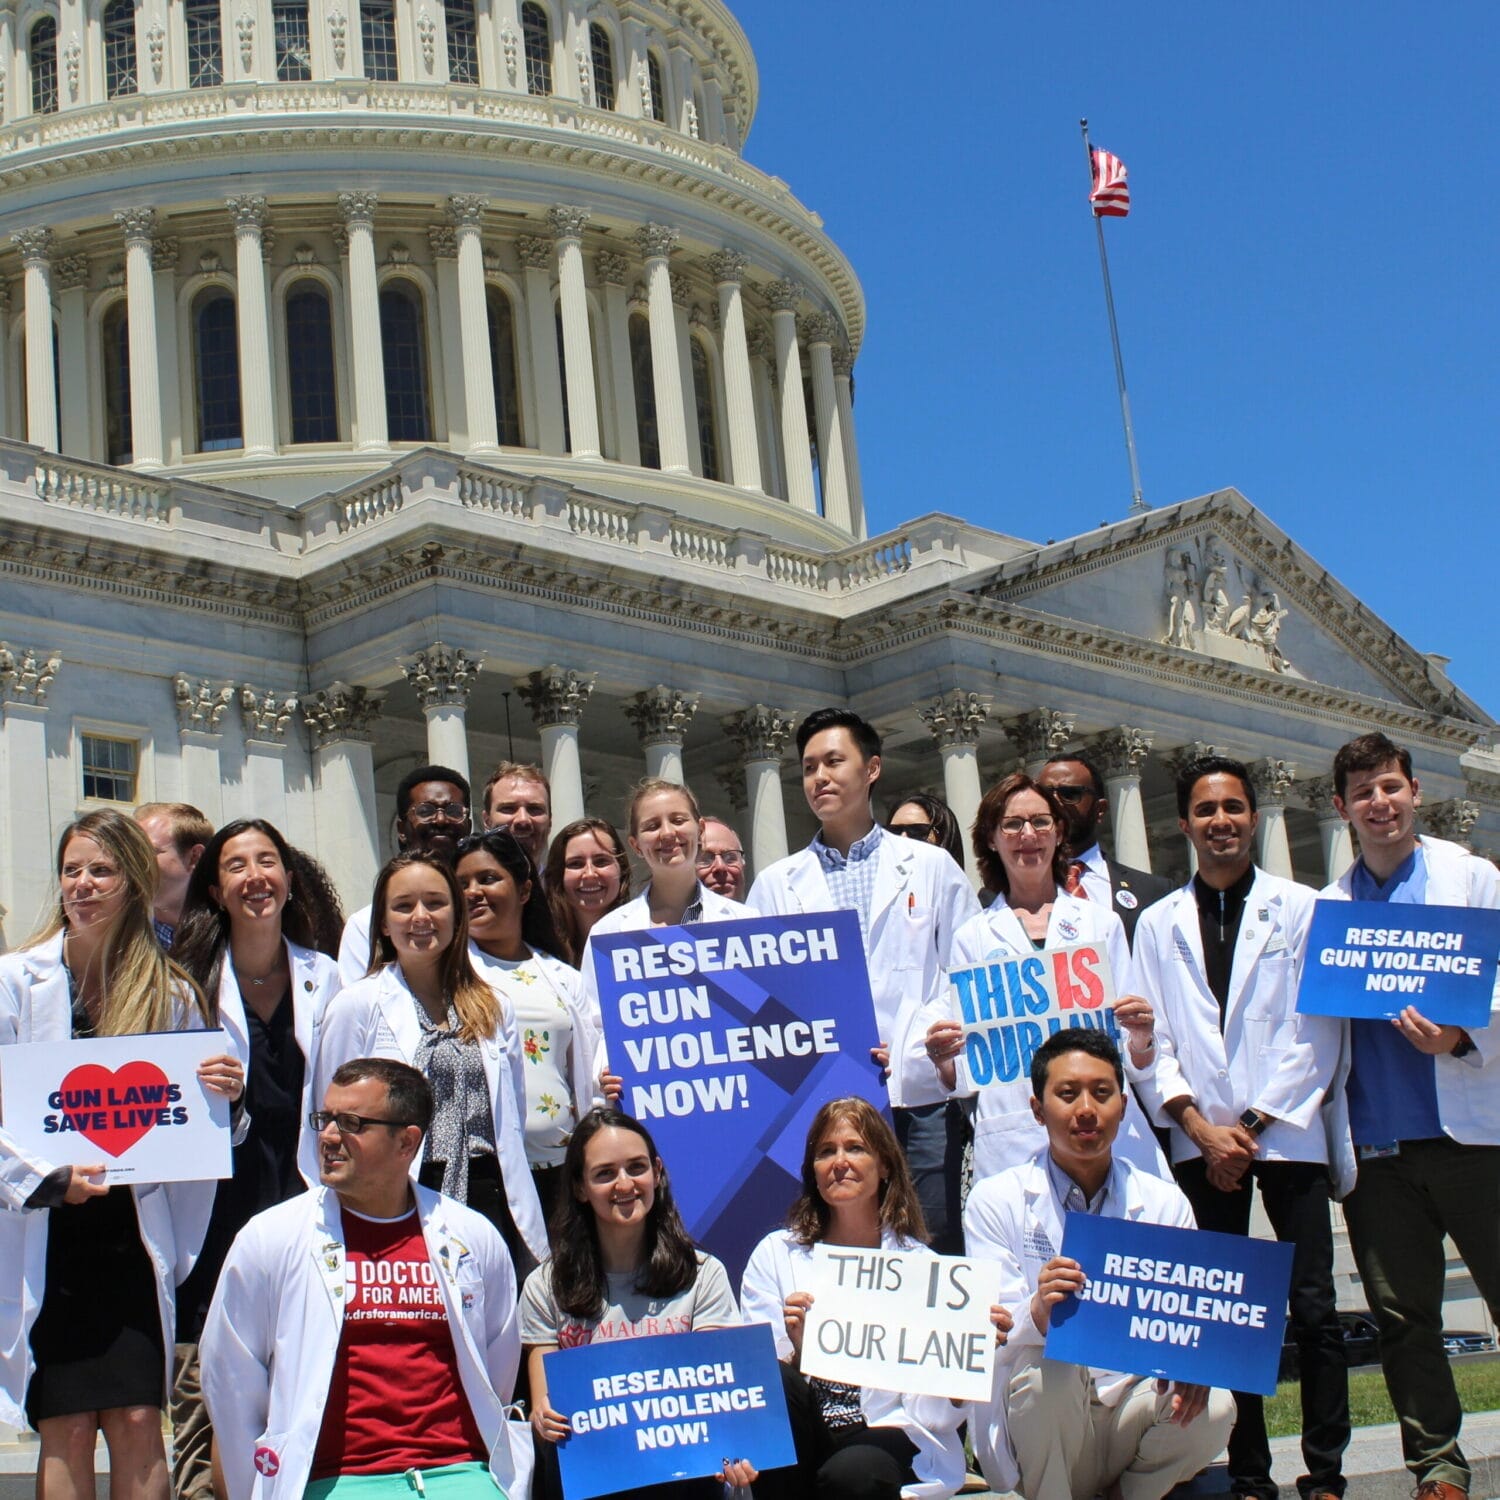
Hispanic and Latino communities disproportionately suffer the consequences of our nation’s gun violence epidemic every day. But collectively, this group is raising its voice and demanding action. Latino voters list gun violence among their most important voting issues,33 and 68% of Hispanic adults support stronger gun laws that would help keep their communities safe.34
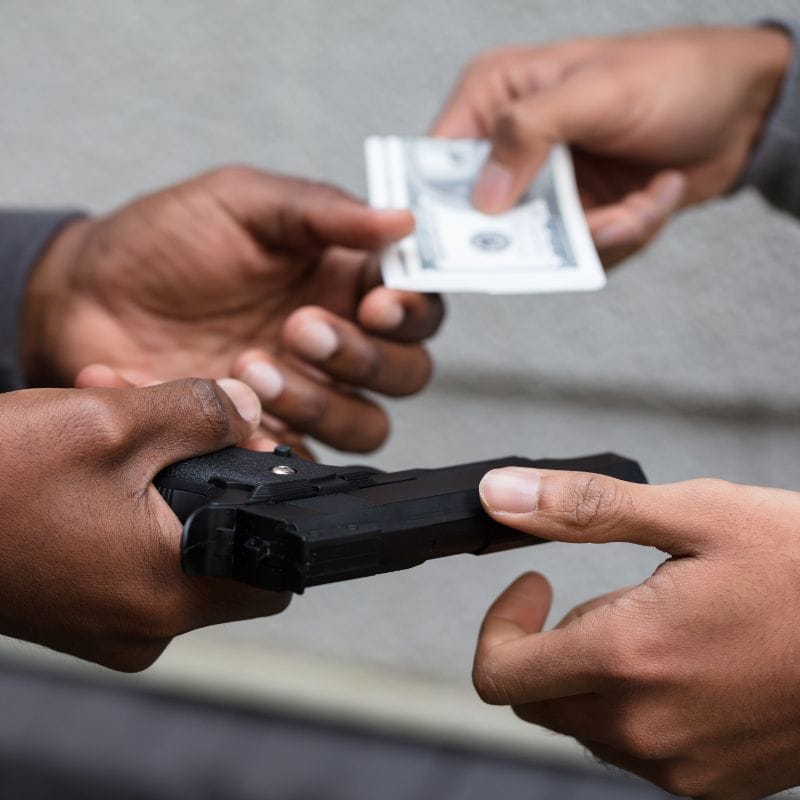
Fortunately, there are a number of policy solutions that would protect Latinos from gun violence, including universal background checks, extreme risk laws, and funding for community violence intervention strategies. These communities are in the throes of our nation’s gun violence crisis, and we can’t wait any longer to implement these lifesaving solutions.
MEDIA REQUESTS
Our experts can speak to the full spectrum of gun violence prevention issues. Have a question? Email us at media@giffords.org.
Contact
- US Census Bureau, “P2 HISPANIC OR LATNO, AND NOT HISPANIC OR LATINO BY RACE,” Decennial Census, 2020, https://data.census.gov/cedsci/table?q=Uvalde%20city,%20Texas&t=Race%20and%20Ethnicity.[↩]
- Jaclyn Diaz, “What we know so far about the school shooting in Uvalde, Texas,” NPR, May 25, 2022, https://www.npr.org/2022/05/25/1101071658/what-we-know-about-uvalde-shooting.[↩]
- Id.[↩][↩][↩][↩]
- Julio Cesar-Chavez, “Accused El Paso Mass Shooter Charged with 90 Counts of Federal Hate Crimes,” Reuters, February 6, 2020, https://www.reuters.com/article/us-texas-shooting-idUSKBN2002PK.[↩]
- From 2020 to 2024, an average of 5,545 Latino Americans died from gun violence each year— more than 15 gun deaths every day. Centers for Disease Control and Prevention, Wide-ranging Online Data for Epidemiologic Research (WONDER), “Underlying Cause of Death, 2018-2024, Single Race,” last accessed March 6, 2026, https://wonder.cdc.gov/.[↩]
- 48.6% of Latinx youth lived within 1300 meters (or approximately 0.8 miles) from a gun homicide within the past year. Nicole Kravitz-Wirtz et al., “Inequities in Community Exposure to Deadly Gun Violence by Race/Ethnicity, Poverty, and Neighborhood Disadvantage among youth in Large US Cities,” Journal of Urban Health 99, (2022): 610–625.[↩]
- From 2015 to 2024, the number of Latino gun deaths rose from 3,332 to 5,381. Nationally, the number of total gun deaths rose from 36,252 to 44,447 during the same period. Centers for Disease Control and Prevention, Wide-ranging Online Data for Epidemiologic Research (WONDER), “Underlying Cause of Death, 2018-2024, Single Race,” last accessed March 6, 2026, https://wonder.cdc.gov/.[↩]
- Based on calculations made by Giffords Law Center. See US Census Bureau, “P2 HISPANIC OR LATINO, AND NOT HISPANIC OR LATINO BY RACE,” Decennial Census, 2020, https://data.census.gov/cedsci/table?t=Hispanic%20or%20Latino&g=0100000US&y=2020&tid=DECENNIALPL2020.P2; US Census Bureau, “B03001 Hispanic or Latino Origin by Specific Origin,” American Community Survey 5-Year Estimates, 2024, https://data.census.gov/table/ACSDT5Y2024.B03001?d=ACS+5-Year+Estimates+Detailed+Tables.[↩]
- Mark Hugo Lopez et al., “Who is Hispanic?,” Pew Research Center, September 23, 2021, https://www.pewresearch.org/fact-tank/2021/09/23/who-is-hispanic/.[↩]
- Antonio Campos, “What’s the Difference Between Hispanic, Latino and Latinx?,” University of California, October 6, 2021, https://www.universityofcalifornia.edu/news/choosing-the-right-word-hispanic-latino-and-latinx. [↩]
- Other mortality outcomes, such as cancer, see disparities by Hispanic and Latino subgroups, but data to analyze disparities among firearm deaths are not available. See Dinorah Martinez Tyson et al., “Unpacking Hispanic Ethnicity—Cancer Mortality Differentials Among Hispanic Subgroups in the United States, 2004-2014,” Frontiers in Public Health, (2018), https://doi.org/10.3389/fpubh.2018.00219.[↩]
- Based on an average of the five most recent years of available data: 2020 to 2024. Centers for Disease Control and Prevention, Wide-ranging Online Data for Epidemiologic Research (WONDER), “Underlying Cause of Death, 2018-2024, Single Race,” last accessed March 6, 2026, https://wonder.cdc.gov/.[↩]
- From 2015 to 2024, the number of Hispanic gun deaths rose from 3,332 to 5,381. Nationally, the number of total gun deaths rose from 36,252 to 44,447 during the same period. Id.[↩]
- 58% of Hispanic gun deaths are gun homicides, 38% are gun suicides, and roughly 1% of gun deaths are from unintentional shootings and from undetermined intent. Id.[↩]
- From 2020 to 2024, the age-adjusted Hispanic firearm homicide rate was 4.73 per 100,000. Comparatively the non-Hispanic White firearm homicide rate during the same period was 2.02 per 100,000. Id. See also Alex R. Piquero, “Racial Inequality in Firearm Homicide Victimization—but not Other Types of US Violence,” Cambridge Journal of Evidence-Based Policing 8, no. 1 (2024).[↩]
- The nine states are: Arizona, California, Colorado, Florida, Illinois, New Jersey, New Mexico, New York, and Texas. See Jeffrey S. Passel et al., “U.S. Hispanic Population Continued its Geographic Spread in the 2010s,” Pew Research Center, February 3, 2022, https://www.pewresearch.org/fact-tank/2022/02/03/u-s-hispanic-population-continued-its-geographic-spread-in-the-2010s/.[↩]
- Based on calculations made by Giffords Law Center. Centers for Disease Control and Prevention, Wide-ranging Online Data for Epidemiologic Research (WONDER), “Underlying Cause of Death, 2018-2024, Single Race,” last accessed March 6, 2026, https://wonder.cdc.gov/.[↩]
- Centers for Disease Control and Prevention, Wide-ranging Online Data for Epidemiologic Research (WONDER), “Underlying Cause of Death, 2018-2024, Single Race,” last accessed March 6, 2026, https://wonder.cdc.gov/.[↩]
- Shani Buggs, “Community-Based Violence Interruption & Public Safety,” Arnold Ventures, July 2022, https://craftmediabucket.s3.amazonaws.com/uploads/AVCJIReport_Community-BasedViolenceInterruptionPublicSafety_Buggs_v2.pdf.[↩]
- The firearm homicide rate for Latino males ages 15-19 from 2020 to 2024 was 16.53 per 100,000. The firearm homicide rate for non-Hispanic white males ages 15-19 during the same time period was 3.43 per 100,000. Centers for Disease Control and Prevention, Wide-ranging Online Data for Epidemiologic Research (WONDER), “Underlying Cause of Death, 2018-2024, Single Race,” last accessed March 6, 2026, https://wonder.cdc.gov/.[↩]
- Melissa E. Smith et al., “The Impact of Exposure to Gun Violence Fatality on Mental Health Outcomes in Four Urban U.S. Settings,” Social Science & Medicine 246, (2020), https://doi.org/10.1016/j.socscimed.2019.112587.[↩]
- From 2020 to 2024, 10,450 Latinos died by firearm suicide. Centers for Disease Control and Prevention, Wide-ranging Online Data for Epidemiologic Research (WONDER), “Underlying Cause of Death, 2018-2024, Single Race,” last accessed March 6, 2026, https://wonder.cdc.gov/.[↩]
- In 2020 the age-adjusted Latino gun suicide rate was 2.45 per 100,000 and in 2024 the rate was 3.47 per 100,000. In 2020 the national age-adjusted gun suicide rate was 6.95 per 100,000 and in 2024 the rate was 7.58 per 100,000. Id.[↩]
- In 2020, the age-adjusted gun suicide rate for Latina women was 0.67 per 100,000 and in 2024, the rate was 0.85 per 100,000. Id.[↩]
- In 2020, the gun suicide rate for Latina women ages 15 to 24 years old was 1.20 per 100,000 and in 2024, the rate was 1.57 per 100,000. In 2020, the gun suicide rate for Latino men ages 15 to 24 years old was 8.23 per 100,000 and in 2024, the rate was 8.14 per 100,000. Id.[↩]
- In 2020, the gun suicide rate for women ages 15 to 24 years old nationally was 1.69 per 100,000 and in 2024, the rate was 1.82 per 100,000. Id.[↩]
- Silvia Foster-Frau, “Latinos are Disproportionately killed by police but often left out of the debate about brutality, some advocates say,” Washington Post, June 2, 2021, https://www.washingtonpost.com/national/police-killings-latinos/2021/05/31/657bb7be-b4d4-11eb-a980-a60af976ed44_story.html.[↩]
- Based on calculations made by Giffords Law Center. See Mapping Police Violence, “National Trends,” last accessed March 9, 2026, https://mappingpoliceviolence.squarespace.com/.[↩]
- From 2020 to 2024, the fatal police shooting rate for Hispanic Americans was 3.42 per 1,000,000. During the same period, the fatal police shooting rate for non-Hispanic White Americans was 2.58 per 1,000,000. Based on calculations made by Giffords Law Center. Mapping Police Violence, “National Trends,” last accessed March 9, 2026, https://mappingpoliceviolence.squarespace.com/; Centers for Disease Control and Prevention, Wide-ranging Online Data for Epidemiologic Research (WONDER), “Underlying Cause of Death, 2018-2024, Single Race,” last accessed March 6, 2026, https://wonder.cdc.gov/.[↩]
- From 2020 to 2024 in New Mexico, the fatal police shooting rate for Hispanic Americans was 15.65 per 1,000,000. During the same period, the fatal police shooting rate for non-Hispanic White Americans was 6.79 per 1,000,000. Based on calculations made by Giffords Law Center. Id.[↩]
- From 2020 to 2024 in California, the fatal police shooting rate for Hispanic Americans was 4.25 per 100,000. During the same period, the fatal police shooting rate for non-Hispanic White Americans was 2.60 per 100,000. Based on calculations made by Giffords Law Center. Id.[↩]
- James H. Price, Jagdish Khubchandani, “Lethal Force Usage by Law Enforcement Officers Against Hispanics, 2011—2020,” Journal of Community Health 48, (2023): 819-823.[↩]
- “UnidosUS Voter Poll: Pocketbook Issues Still Top Latino Priorities,” UnidosUS, September 4, 2024, https://unidosus.org/press-releases/unidosus-voter-poll-pocketbook-issues-still-top-latino-priorities/; “UnidosUS and Mi Familia Vota National Survey of Latino Voters,” UnidosUS, August 10, 2022, https://www.unidosus.org/publications/unidosus-and-mi-familia-vota-national-survey-of-latino-voters/; “UnidosUS National Latino Voter Survey,” UnidosUS, November 13, 2023, https://unidosus.org/wp-content/uploads/2023/11/unidosus_national_surveyoflatinovoters_crosstabs.pdf; Clifford Young, Bernard Mendez, Sarah Feldman, “Where Latino Americans stand heading into the 2024 election,” Ipsos, April 12, 2024, https://www.ipsos.com/en-us/where-latino-americans-stand-heading-2024-election. See also, “UnidosUS Bipartisan Poll of Hispanic Voters in California: The Road to 2026.” UnidosUS, November 3, 2025, https://unidosus.org/wp-content/uploads/2025/11/unidosus_2025bipartisanpollofhispanicvoters_california_deck.pdf.[↩]
- Pew Research Center, “Gun Violence Widely Viewed as a Major – and Growing – National Problem,” June 28, 2023, https://www.pewresearch.org/politics/2023/06/28/gun-violence-widely-viewed-as-a-major-and-growing-national-problem/.[↩]