
Gun Violence in Asian and Pacific Islander Communities
BROWSE
Sections on this page
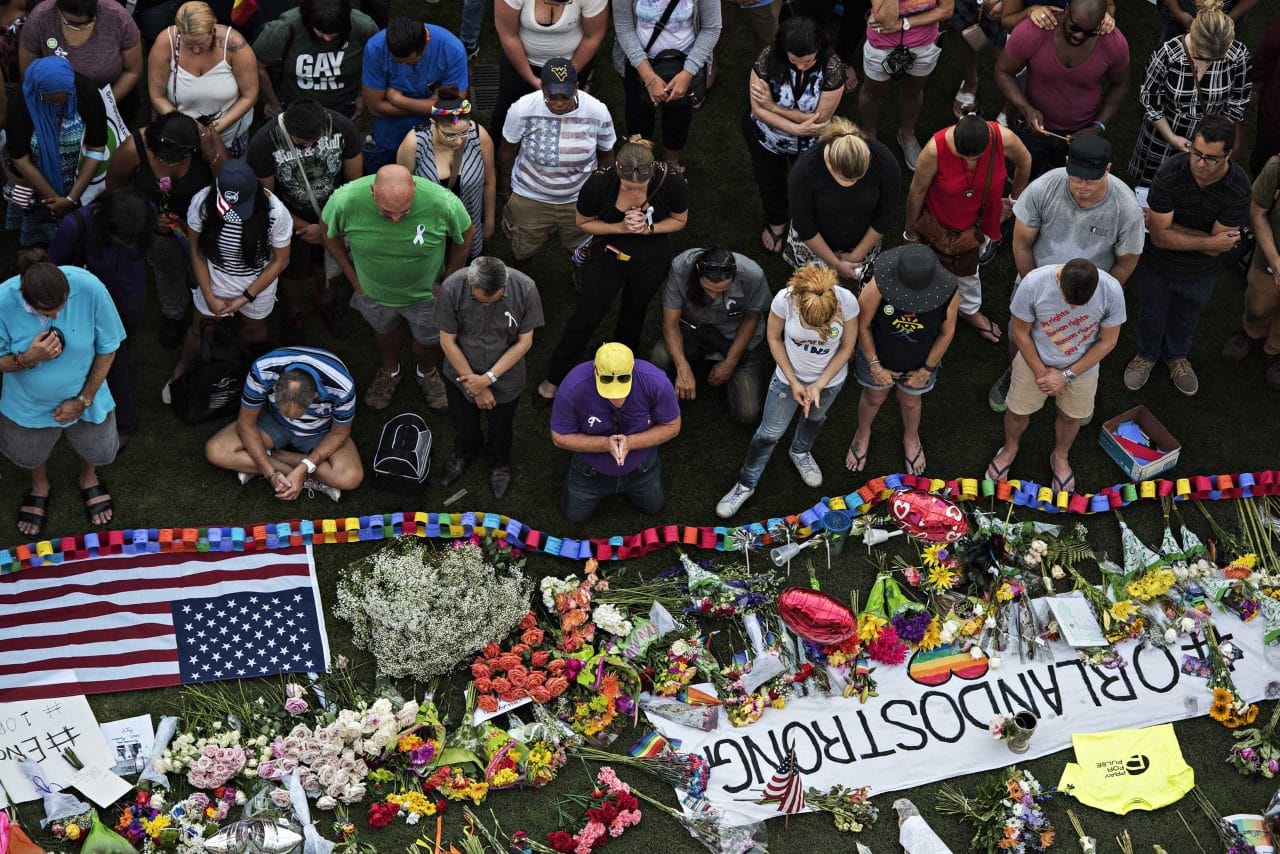
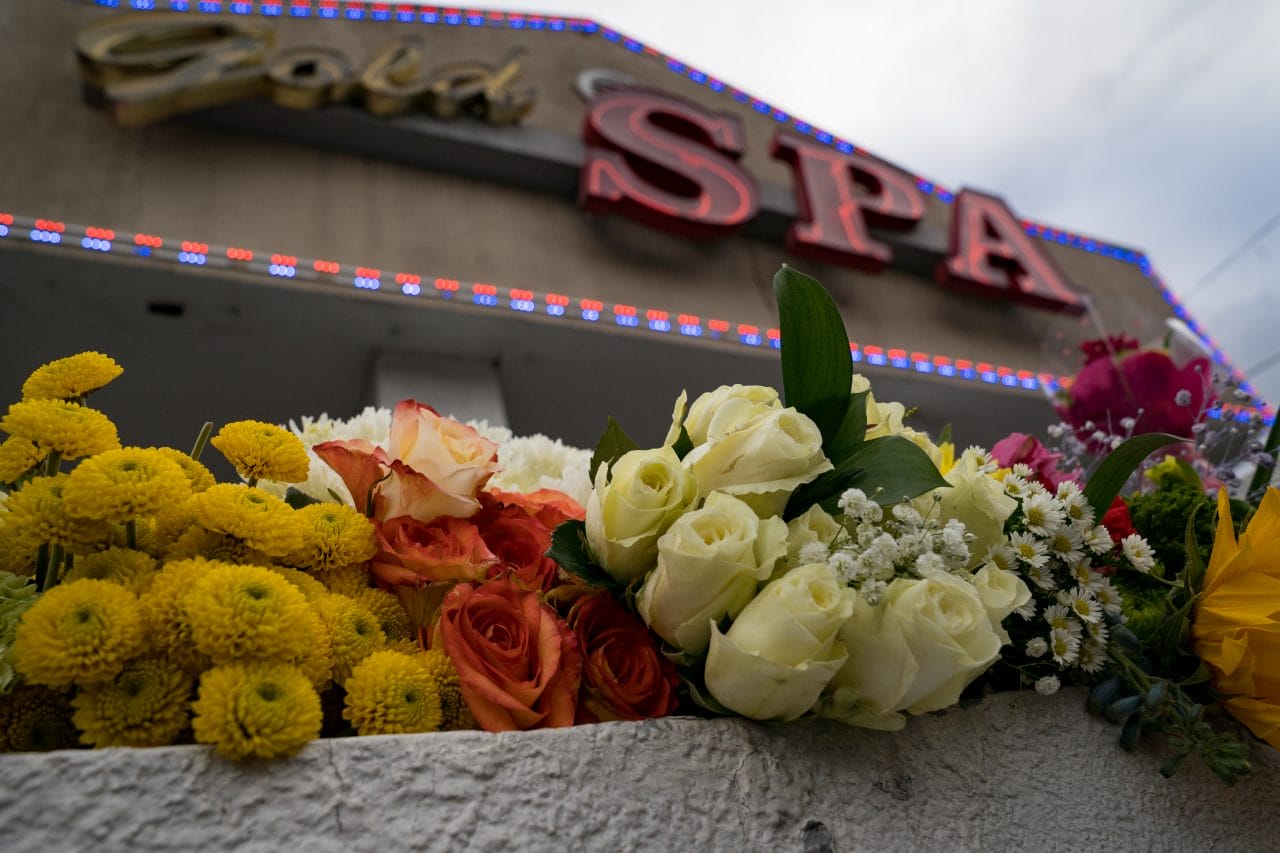
Asian American communities across the country have been rocked by high profile mass shootings in recent years. Atlanta, Georgia; Allen, Texas; Monterey Park, California; and Half Moon Bay, California, have all been sites of terrible tragedy—elevating gun violence into an urgent issue among Asian Americans nationwide. Additionally, the anti-Asian hate crimes that increased during the COVID-19 pandemic1 and that have sustained in recent years2 have forced Asian Americans to rethink their own public safety. Some have turned to purchasing firearms as a method of feeling safer. As a result, guns and gun violence have become an increasingly urgent issue within the Asian American community.
Gun violence affects Asian American and Pacific Islander communities across the country every day. Over the past five years, the total number of gun deaths among Asian and Pacific Islanders (APIs) has increased—fueled mainly by increases in firearm suicides.3 While the COVID-19 pandemic exacerbated mental health among Asian Americans,4 the continued upward trajectory of firearm suicides underscores the importance of gun violence in API communities.
On Ethnic Group Terminology
This memo gathers data from the Centers for Disease Control and Prevention (CDC), where demographic data is separated by racial and ethnic groups. In 2021, the CDC separated the API category to two separate groupings: “Asian” and “Native Hawaiian or Other Pacific Islander.” Individuals within the “Asian” category may have origins from East Asia, Southeast Asia, and South Asia, and may be from countries such as China, India, Japan, Korea, the Philippines, or Vietnam. Within the “Native Hawaiian or Other Pacific Islander” group, individuals identify as Hawaiian, Guamanian, Samoan, or from other Pacific Island communities and nations.
In this memo, we have separated Asian Americans and Pacific Islanders when sufficient data was available. We did this to provide as much detail and distinction between these categories in order to acknowledge how gun violence affects these communities of varying histories, cultures, and geographies differently.
GET THE FACTS
Gun violence is a complex problem, and while there’s no one-size-fits-all solution, we must act. Our reports bring you the latest cutting-edge research and analysis about strategies to end our country’s gun violence crisis at every level.
Learn More
National Trends
While each of these gun deaths takes a devastating toll on families and communities, available data suggests that rates of gun violence in API communities are lower than those of other racial and ethnic groups. For example, from 2020 to 2024, the national gun death rate was nearly five times higher than the Asian American gun death rate and 1.4 times greater than the Pacific Islander gun death rate.7 During that same time period, APIs accounted for nearly 7% of the population but only 1.4% of total gun deaths, 1.2% of firearm homicides, and 1.5% of firearm suicides.8
While gun death rates have been historically lower among APIs compared to other groups, in recent years, the total gun death rate among APIs have remained fairly flat.9 However, focusing solely on the total gun death rate obscures underlying trends.
For example, from 2020 to 2024, the Asian American firearm suicide rate rose nearly 12%.10 During the same period, the firearm homicide rate for the group fell roughly 14%.11 Similarly, among Pacific Islanders, the firearm suicide rate increased 17% between 2020 and 2024.12 However, the firearm homicide rate fell 33% among Pacific Islanders during the same period.13 Contrastingly, the national gun death rate fell 6% during the same period,14 but the decrease nationally was driven mostly by a 24% fall in the gun homicide rate.15 Additionally, the firearm suicide rate increase seen nationally (9%) was still lower than the increase seen among APIs.16
The data shows that Pacific Islanders, on average, experience higher rates of gun deaths than Asian Americans. For example, the Pacific Islander total gun death rate is three and a half times higher than the Asian American total gun death rate and the Pacific Islander gun suicide rate is more than twice that of the Asian American gun suicide rate.17
Ethnic-Specific Trends
As of 2024, approximately 28.2 million API people—26.4 million people of Asian descent and 1.8 million people of Native Hawaiian or Pacific Islander descent—currently live in the US.18 Individuals under the API umbrella can trace their heritage to dozens of different regions, countries, and ethnic groups around the globe. In the US, people of East Asian descent make up the largest subgroup under the API umbrella,19 but no subgroup makes up a majority.
While these groups are often pooled under the API banner for statistical analysis, research shows that there are meaningful disparities among APIs. For example, in 2023, the annual median household income for Asian Americans was about $105,600.20 However, Asian Americans experience the largest annual median household income gap among all racial/ethnic groups. Asian Indian Americans had a median household income of $151,200, whereas Mongolian Americans had an annual median household income of only $54,300.21
For decades, community leaders and scholars alike have called for data disaggregation,22 or the practice of separating data by ethnic group to help unmask differences among these distinct groups. Data disaggregation allows a fuller, more nuanced understanding as to the impacts of gun violence on these individual communities.
In 2018, the CDC began publishing disaggregated data on 11 separate API groups.23 The following information uses this new CDC data to showcase the disparate impact of gun violence on individual Asian and Pacific Islander communities.
The data shows that Pacific Islanders, as well as South and Southeast Asians, experience gun violence at much higher rates than East Asians. Among all API ethnic subgroups with disaggregated data, Samoans had the highest total gun death rate (8.45 per 100,000), the highest firearm homicide rate (5.41 per 100,000), and the highest firearm suicide rate (2.70 per 100,000).24 The Samoan total gun death rate was nearly three times the API total gun death rate.25 Additionally, the Samoan firearm homicide rate was five times higher than the API firearm homicide rate, while the Samoan firearm suicide rate was almost 1.4 times higher than the API firearm suicide rate.26
Among the Asian ethnic subgroups, the “Other Asian” category, which includes aggregate data from mainly South and Southeast Asian ethnicities not disaggregated by the CDC, had the highest total gun death, firearm homicide, and firearm suicide rates.21
Among Asian ethnic groups in America with disaggregated data, Vietnamese had the highest total gun death rate (3.29 per 100,000) followed by Koreans (2.98 per 100,000). Vietnamese also had the highest gun homicide rate (1.14 per 100,000) among Asian ethnic groups with disaggregated data, followed by Asian Indians (0.86 per 100,000).27 Koreans and Vietnamese had similarly higher rates of firearm suicide (2.25 per 100,000 and 2.05 per 100,000) among Asian Americans.28
Suicide
Although the API suicide rate is half that of the national average, there have been concerning trends in gun suicide deaths in this community. Between 2020 and 2024 there was a 12% increase in the Asian American firearm suicide rate and a 17% increase among Pacific Islanders.29 The share of suicides that involve a firearm in these communities has grown dramatically. In 2020, about 25% of API suicides involved a firearm.30 In 2024, the share of API suicides that involved a firearm jumped to 28%.31
While researchers are still working to understand the factors underlying the rise in suicides among API communities, preliminary research suggests that many of the social and economic upheavals of the COVID-19 pandemic, as well as increasing anxiety about bias-motivated crime, may have contributed to these emerging trends.
API youth and young adults have been particularly impacted by rising gun suicides. Data shows that between 2020 and 2024, 15% of firearm suicides in API communities involved 20- to 24-year-olds.32 One study found that suicide rates among young Asian Americans had grown as a consequence of the disproportionate effect of economic disruptions this group faced during COVID-19.33 In fact, two-thirds of young adult Asian Americans reported increased symptoms of depression during this period.34 Additionally, 76% of young adult Asian Americans reported feeling less safe post-COVID-19 due to anti-Asian racism.21 Combined, the mental health toll of racism and anti-Asian bias in recent years may have exacerbated suicide risk.35
Over the past several years, surveys and qualitative accounts have documented how the hate and vitriol directed towards Asian Americans have made them feel less safe. Much of the fears around public safety among Asian Americans stem from the falsehoods that sprung up during the COVID-19 pandemic that blamed the origins of the virus on people of Chinese descent. This misinformation had real-world consequences—including an onslaught of racist and discriminatory behavior and even violence against Asian Americans.36

At the height of the COVID-19 pandemic, there were a record number of anti-Asian hate crimes; in 2021, there were nearly 800 anti-Asian hate crimes reported to law enforcement.37 However, research has repeatedly shown that hate crimes are severely underreported, leading to a misrepresentation of this landscape.38 The COVID-19 pandemic era placed API communities in the perilous spot of facing the double threat of violence and a virulent pandemic.39 Even after the anti-Asian rhetoric related to the pandemic has declined, anti-Asian hate crimes remain high. In 2024, the FBI recorded the third highest number of anti-Asian hate crimes since tracking began.40
As experiences of racially charged hate crimes and abuse have increased since 2020, increased anxiety, fear, and depression and subsequent suicidal ideation have also become common among API communities as well.41 These effects may have been exacerbated by the recent increases in anti-immigrant rhetoric.42
Fears around public safety may also be contributing to Asian Americans seeking out different modes of self-protection. Polling and anecdotal data both suggest that gun buying may have accelerated in API communities. Indeed, as Asian Americans have felt more threatened or experienced racism during this period, data has shown that they have been more likely to purchase a firearm.43
The most recent National Firearms Survey, for example, shows that overall gun owners are predominantly white (73%) with only 6% identifying as “Other,” including APIs.44 However, from January 2019 to April 2021, gun buyers were more likely to be people of color, with 9% identifying as “Other,” again including APIs.45 Additionally, over half of Asian American gun owners surveyed were found to be first time gun purchasers during this early portion of the pandemic.46 This data suggests that gun buying among APIs may have been on the rise both before and during the early days of the pandemic. Importantly, the increased gun purchasing could have devastating consequences and push rates of gun violence even higher.47

The impact of anti-Asian hate during COVID-19 is an inflection point in gun ownership in America. Even among Asian American gun owners, those who experienced increased racial discrimination were more likely to carry their firearms more frequently.43
In fact, mental stress experienced from COVID-19’s anti-Asian hatred and fear has been found to increase alcohol consumption among Asian Americans.48 Subsequently, this increased alcohol consumption and mental distress has been associated with more gun purchasing.48 Furthermore, experiences of racism and concerns around safety have also been associated with firearm purchasing among Asian Americans.49 This network of social, psychological, and racial events experienced by APIs in recent years has demonstrated the extent to which gun violence is bolstered by a myriad of issues experienced in the nation.
Noticing the trend in gun buying among API communities, the gun lobby, which has long capitalized on xenophobic, racist, fear-mongering messaging, is now courting new customers.50 Leading members of the gun lobby have created groups and increased their marketing of firearms to the API community.21 And API gun owner groups have even sprouted to educate and give a new sense of community to this emerging group of gun owners.51
The gun lobby’s marketing of firearms as a measure of safety in fact contradicts research that demonstrates how dangerous the presence of a gun is in a home, especially increasing the risk of firearm suicide. Studies have shown that firearm access can triple the risk of suicide.52 Additionally, teen and youth firearm suicide can largely be attributed to access to household firearms, often belonging to a parent or other family member. Research also demonstrates that household firearms increase the risk of homicide, including intimate partner homicides.53
Conclusion
Asian and Pacific Islanders are the fastest growing racial/ethnic group in the country.54 As the gun lobby increasingly targets Asian and Pacific Islanders to join their ranks, our leaders must do more to enact the kinds of policies that help mitigate the risk of gun violence. Data has shown that Asian Americans across different ethnic subgroups support stronger gun safety laws and believe that gun safety is of paramount importance when voting in elections.55 Asian and Pacific Islanders, just like all Americans, deserve to live free from gun violence, and deserve legislators who can make this dream a reality.
A special thanks to Sophie Yap for her work on previous versions of this report.
MEDIA REQUESTS
Our experts can speak to the full spectrum of gun violence prevention issues. Have a question? Email us at media@giffords.org.
Contact

- Sungil Han, Jordan R. Riddell, Alex R. Piquero, “Anti-Asian American Hate Crimes Spike During the Early Stages of the COVID-19 Pandemic,” Journal of Interpersonal Violence 38, (2023).[↩]
- Aleisha Flores, “2025 FBI Hate Crime Data Reveals Threats to Asian American Communities,” Asian Americans Advancing Justice, (2026), https://www.advancingjustice-aajc.org/press-release/2025-fbi-hate-crime-data-reveals-threats-asian-american-communities.[↩]
- Centers for Disease Control and Prevention, Wide-ranging Online Data for Epidemiologic Research (WONDER), “Underlying Cause of Death, 2018-2024, Single Race,” last accessed April 15, 2026, https://wonder.cdc.gov/.[↩]
- See, Sasha Zhou, Rachel Banawa, and Hans Oh, “The Mental Health Impact of COVID-19 Racial and Ethnic Discrimination Against Asian American and Pacific Islanders,” Frontiers in Psychology, (2021); James Huynh, et al., “The mental health of Asian American adolescents and young adults amid the rise of anti-Asian racism,” Frontiers in Public Health 10, (2022). [↩]
- From 2020 to 2024, there were 2,943 total gun deaths among non-Hispanic Asian Americans and 326 total gun deaths among non-Hispanic Pacific Islanders. Centers for Disease Control and Prevention, Wide-ranging Online Data for Epidemiologic Research (WONDER), “Underlying Cause of Death, 2018-2024, Single Race,” last accessed April 15, 2026, https://wonder.cdc.gov/.[↩]
- Firearm suicides account for 62% of all API gun deaths followed by firearm homicides (34%), and unintentional gun deaths (0.9%).Based on a five year average of the most recent years of data: 2020 to 2024.Id.[↩]
- From 2020 to 2024, the non-Hispanic Asian American age-adjusted total gun death rate was 2.80 per 100,000. During the same time period, the non-Hispanic Native Hawaiian or Other Pacific Islander age-adjusted total gun death rate was 9.81 per 100,000. During the same time period, the national age-adjusted total gun death rate was 13.78 per 100,000. Id.[↩]
- From 2020 to 2024, the estimated non-Hispanic Asian American and Pacific Islander population was 105,295,078 and the estimated total population was 1,669,691,308. During the same time period, there were 3,629 gun deaths among non-Hispanic Asian Americans and Pacific Islanders and 233,431 total gun deaths nationally. During the same period, there were 1,118 firearm homicides among non-Hispanic Asian Americans and Pacific Islanders and 93,284 firearm homicides seen nationally. During the same time period there were 2,036 firearm suicides among non-Hispanic Asian Americans and Pacific Islanders and 132,545 firearm suicides seen nationally. Id.[↩]
- In 2020, the non-Hispanic Asian American age-adjusted total gun death rate was 2.60 per 100,000 and in 2024, the rate was 2.63 per 100,000. In 2020, the non-Hispanic Native Hawaiian or Other Pacific Islander age-adjusted total gun death rate was 9.06 per 100,000 and in 2024, the rate was 8.61 per 100,000. Id.[↩]
- In 2020, the non-Hispanic Asian American age-adjusted firearm suicide rate was 1.62 per 100,000 and in 2024, the rate was 1.81 per 100,000. Id.[↩]
- In 2020, the non-Hispanic Asian American age-adjusted firearm homicide rate was 0.85 per 100,000 and in 2024, the rate was 0.73 per 100,000. Id.[↩]
- In 2020, the non-Hispanic Native Hawaiian or Other Pacific Islander age-adjusted firearm suicide rate was 3.20 per 100,000 and in 2024, the rate was 3.81 per 100,000. Id.[↩]
- In 2020, the non-Hispanic Native Hawaiian or Other Pacific Islander age-adjusted firearm homicide rate was 5.40 per 100,000 and in 2024, the rate was 3.63 per 100,000. Id.[↩]
- In 2020, the age-adjusted total gun death rate nationally was 13.62 per 100,000. In 2024, the rate was 12.75 per 100,000. Id.[↩]
- In 2020, the age-adjusted firearm homicide rate nationally was 6.19 per 100,000. In 2024, the rate was 4.74 per 100,000. Id.[↩]
- In 2020, the age-adjusted firearm suicide rate nationally was 6.95 per 100,000. In 2024, the rate was 7.58 per 100,000. Id.[↩]
- The total gun death rate among non-Hispanic Asian Americans from 2020 to 2024 was 2.80 per 100,000. The total gun death rate among non-Hispanic Pacific Islanders from 2020 to 2024 was 9.81 per 100,000. The firearm suicide rate among non-Hispanic Asian Americans from 2020 to 2024 was 1.78 per 100,000. The firearm suicide rate among non-Hispanic Pacific Islanders was 4.15 per 100,000. Id.[↩]
- US Census Bureau, “S0201 Selected Population Profile in the United States,” American Community Survey 1-Year Estimates, 2024, https://data.census.gov/table/ACSSPP1Y2024.S0201?t=-02:001&y=2024. [↩]
- People of East Asian descent are those who can trace their ethnic heritage to the Chinese, Japanese, Korean, Mongolian, Okinawan, and Taiwanese ethnicities.[↩]
- Jens Manuel Krogstad and Carolyne Im, “Key facts about Asians in the U.S.,” Pew Research Center, May 1, 2025, https://www.pewresearch.org/short-reads/2025/05/01/key-facts-about-asians-in-the-us/. [↩]
- Id.[↩][↩][↩][↩]
- See, Adrian Bacong, Alex Nguyen, and Anna K. Hing, “Making The Invisible Visible: The Role Of Public Health Critical Race Praxis In Data Disaggregation Of Asian Americans And Pacific Islanders In The Midst Of The COVID-19 Pandemic,” AAPI Nexus Journal: Police, Practice and Community 17, no. 1&2 (2019); Nadia Shilpi Islam et al., “Methodological Issues In the Collection, Analysis, and Reporting of Granular Data in Asian American Populations: Historical Challenges and Potential Solutions,” Journal of Health Care for the Poor and Underserved, 21(4), 1354–81; Sobha Srinivasan and Tessie Guillermo, “Toward Improved Health: Disaggregating Asian American and Native Hawaiian/Pacific Islander Data,” American Journal of Public Health 90, no. 11 (2000): 1731–4, doi:10.2105/ajph.90.11.1731.[↩]
- The 15 groups within this categorization include: White, Black, American Indian or Alaska Native, Asian Indian, Chinese, Filipino, Japanese, Korean, Vietnamese, Other Asian, Hawaiian, Guamanian, Samoan, Other Pacific Islander, and More than One Race.[↩]
- 5-year rates were generated (2020 to 2024) based on calculations made by Giffords Law Center. Centers for Disease Control and Prevention, Wide-ranging Online Data for Epidemiologic Research (WONDER), “Underlying Cause of Death, 2018-2024, Single Race,” last accessed April 15, 2026, https://wonder.cdc.gov/. US Census Bureau, “S0201 SELECTED POPULATION PROFILE IN THE UNITED STATES,” American Community Survey 1-Year Estimates, 2024, https://data.census.gov/table/ACSSPP1Y2024.S0201?t=-04&moe=false. [↩]
- From 2020 to 2024, the Asian American and Native Hawaiian or Other Pacific Islander total gun death rate was 3.10 per 100,000 while the Samoan total gun death rate was 8.45 per 100,000. Id.[↩]
- From 2020 to 2024, the Asian American and Native Hawaiian or Other Pacific Islander firearm homicide rate was 1.06 per 100,000 and the firearm suicide rate was 1.93 per 100,000. Id.[↩]
- Among other Asian ethnic groups (Chinese, Filipino, Japanese, and Korean) the firearm homicide crude rate remained below 0.65 per 100,000 from 2020 to 2024. Id.[↩]
- Id.[↩]
- In 2020, the age-adjusted firearm suicide rate among Asian Americans was 1.62 per 100,000 and in 2024 the rate was 1.81 per 100,000. In 2020, the age-adjusted firearm suicide rate among non-Hispanic Native Hawaiian or Other Pacific Islanders was 3.24 per 100,000 and in 2024 the rate was 3.81 per 100,000.Id.[↩]
- In 2020, there were 343 firearm suicides among non-Hispanic Asian Americans and Pacific Islanders and 1,381 total suicide deaths. Id.[↩]
- In 2024, there were 445 firearm suicides among non-Hispanic Asian Americans and Pacific Islanders and 1,604 total suicide deaths. Id.[↩]
- Id. Asian American and Pacific Islander data was aggregated here as there was insufficient information for each age group in the separated racial categories.[↩]
- Kodai Kusano, Ayse K. Uskul, and Markus Kemmelmeier, “Suicide During the COVID-19 Pandemic: Uncovering Demographic and Regional Variation in the United States and Associations with Unemployment and Depression,” Current Research in Ecological & Social Psychology, (2023).[↩]
- James Huynh et al., “The Mental Health of Asian American Adolescents and Young Adults Amid the Rise of Anti-Asian Racism,” Frontiers in Public Health, (2023).[↩]
- John Gramlich, “Gun Deaths Among U.S. Children and Teens Rose 50% in Two Years,” Pew Research Center, April 6, 2023, https://www.pewresearch.org/short-reads/2023/04/06/gun-deaths-among-us-kids-rose-50-percent-in-two-years/.[↩]
- Yulin Hswen et al., “Association of “#covid19” Versus “#chinesevirus” With Anti-Asian Sentiments on Twitter: March 9–23, 2020,” American Journal of Public Health, (2021).[↩]
- “FBI Crime Data Reporter, Hate Crime in the United States Incident Analysis,” Federal Bureau of Investigation, last accessed: April 15, 2026, https://cde.ucr.cjis.gov/LATEST/webapp/#/pages/explorer/crime/hate-crime.[↩]
- Sergio Olmos, “Researchers say the FBI’s statistics on hate crimes across the country are flawed,” National Public Radio, January 1, 2023, https://www.npr.org/2023/01/01/1145973412/researchers-say-the-fbis-statistics-on-hate-crimes-across-the-country-are-flawed. See also, Grace Kena and Alexandra Thompson, “Hate Crime Victimization, 2005-2019,” Bureau of Justice Statistics, (2021), https://bjs.ojp.gov/media/64996/download. [↩]
- Neil G, Ruiz, Carolyne Im, and Ziyao Tian, “DISCRIMINATION EXPERIENCES SHAPE MOST ASIAN AMERICANS’ LIVES,” Pew Research Center, November 30, 2023, https://www.pewresearch.org/race-ethnicity/2023/11/30/asian-americans-and-discrimination-during-the-covid-19-pandemic/. [↩]
- Michelle Boykins, “Asian American Hate Incidents Remain Alarmingly High According to Newly Released FBI Hate Crime Data,” Asian Americans Advancing Justice, August 5, 2025, https://www.advancingjustice-aajc.org/press-release/asian-american-hate-incidents-remain-alarmingly-high-according-newly-released-fbi. See also, “The State of Anti-AA/PI Hate in 2025,” Stop AAPI Hate, April 1, 2026, https://stopaapihate.org/2026/05/01/state-of-hate-may26/.[↩]
- James Huynh et al., “The mental health of Asian American adolescents and young adults amid the rise of anti-Asian racism,” Frontiers in Public Health, (2023); Sasha Zhou, Rachel Banawa, and Hans Oh, “The Mental Health Impact of COVID-19 Racial and Ethnic Discrimination Against Asian American and Pacific Islanders,” Frontiers in Psychology, (2021).[↩]
- Terry Tang, “5 years after pandemic surge, Asian Americans and Pacific Islanders still targets of hatred,” PBS News, May 27, 2025, https://www.pbs.org/newshour/nation/5-years-after-pandemic-surge-asian-americans-and-pacific-islanders-still-targets-of-hatred.[↩]
- Tsu-Yin Wu et al., “Examining racism and firearm-related risks among Asian Americans in the United States during the COVID-19 pandemic,” Preventive Medicine Reports 27, (2022).[↩][↩]
- Matthew Miller, Samuel Fischer, Deborah Azrael, “Firearm Acquisition and New Exposure to Household Firearms After the Initial Pandemic Purchasing Surge: Results From the 2024 National Firearms Survey,” Annals of Internal Medicine, (2026).[↩]
- Matthew Miller, Wilson Zhang, and Deborah Azrael, “Firearm Purchasing During the COVID-19 Pandemic: Results from the 2021 National Firearms Survey,” Annals of Internal Medicine 175, no. 2 (2022): 219-225.[↩]
- Tsu-Yin Wu et al., “Examining racism and firearm-related risks among Asian Americans in theUnited States during the COVID-19 pandemic,” Preventive Medicine Reports 27, (2022).[↩]
- The term Asian American is used here because the articles on gun buying specifically mention Asian American gun buying and do not discuss gun buying amongst Native Hawaiian and/or Pacific Islander communities.[↩]
- Id.[↩][↩]
- Tsu-Yin Wu, Szu-Hsien Chen, Xining Yang, Ken Resnicow, Hsing-Fang Hsieh, “Using photovoice to understand community perceptions of firearm risks and protective factors among Asian Americans,” American Journal of Community Psychology (2026).[↩]
- “How the Firearms Industry Markets Guns to Asian Americans,” Violence Policy Center, September 2021, https://vpc.org/studies/AAPI2021.pdf.[↩]
- Claire Wang, “Asian Americans are buying guns in record numbers. What’s caused this surge?” The Guardian, August 16, 2022. https://www.theguardian.com/us-news/2022/aug/16/asian-americans-gun-ownership.[↩]
- Andrew Anglemyer, Tara Horvath, and George Rutherford, “The Accessibility of Firearms and Risk for Suicide and Homicide Victimization Among Household Members: A Systematic Review and Meta-Analysis,” Annals of Internal Medicine 160, no. 2 (2014): 101–10.[↩]
- Renee M. Johnson et al. “Who Are the Owners Of Firearms Used In Adolescent Suicides?” Suicide and Life-Threatening Behavior 40, no. 6 (2010): 609–11.[↩]
- Abby Budiman and Neil G. Ruiz, “Key Facts About Asian Origin Groups In the U.S.,” Pew Research Center, April 21, 2021, https://www.pewresearch.org/fact-tank/2021/04/29/key-facts-about-asian-origin-groups-in-the-u-s/#:~:text=Asian%20households%20in%20the%20U.S.[↩]
- “National AAPI Amplify Survey,” APIA Vote, November, 2025, https://apiavote.org/wp-content/uploads/AAPI-voter-survey-presentation.pdf; “Gun Violence Widely Viewed as a Major – and Growing – National Problem,” Pew Research Center, June 28, 2023, https://www.pewresearch.org/politics/2023/06/28/gun-violence-widely-viewed-as-a-major-and-growing-national-problem/.[↩]